Value Card
A Value Card provides a snapshot of real-time data by displaying the latest value from a message received via a connected channel.
Create a Value Card
To create a Value Card, ensure the dashboard is in Edit Mode.
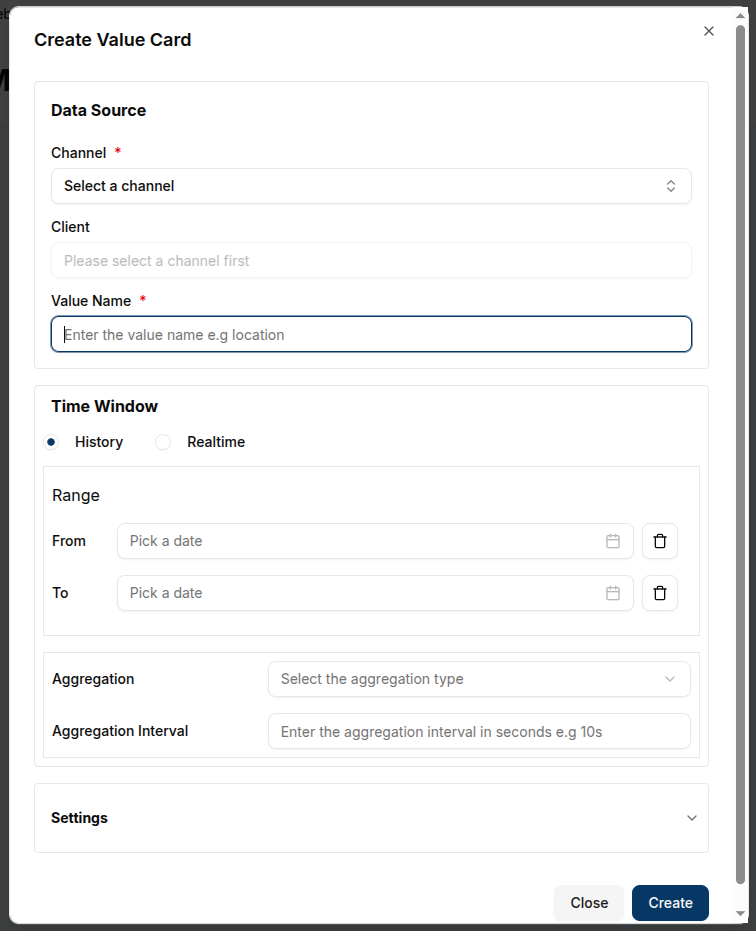
Click the Add Widget button and select Value Card from the list of available widgets. This will open the Create Value Card dialog, where the data source and appearance of the card can be configured.
Configuring the Value Card
- Channel: Select the channel from which the card will pull data.
- Client: Choose the connected device (client) associated with the channel.
- Value Name: Enter the value name to display on the card (e.g., volume).
- Title: Provide a title for the Value Card, which will be displayed at the top of the widget.
- Unit: Provide a unit for the data to be displayed.
- Label: Provide a label for the data to be displayed.
 7. Icon: Select an icon to visually represent the data displayed. A range of icons is available to match the context of the value.
![]()
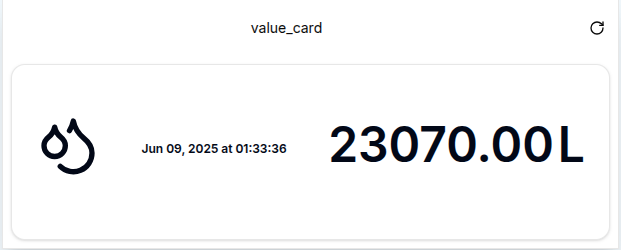
After all fields are configured, click the Create button to add the Value Card to the dashboard.
The card will immediately display the latest value from the channel, along with the associated unit and selected icon.
Edit the Value Card
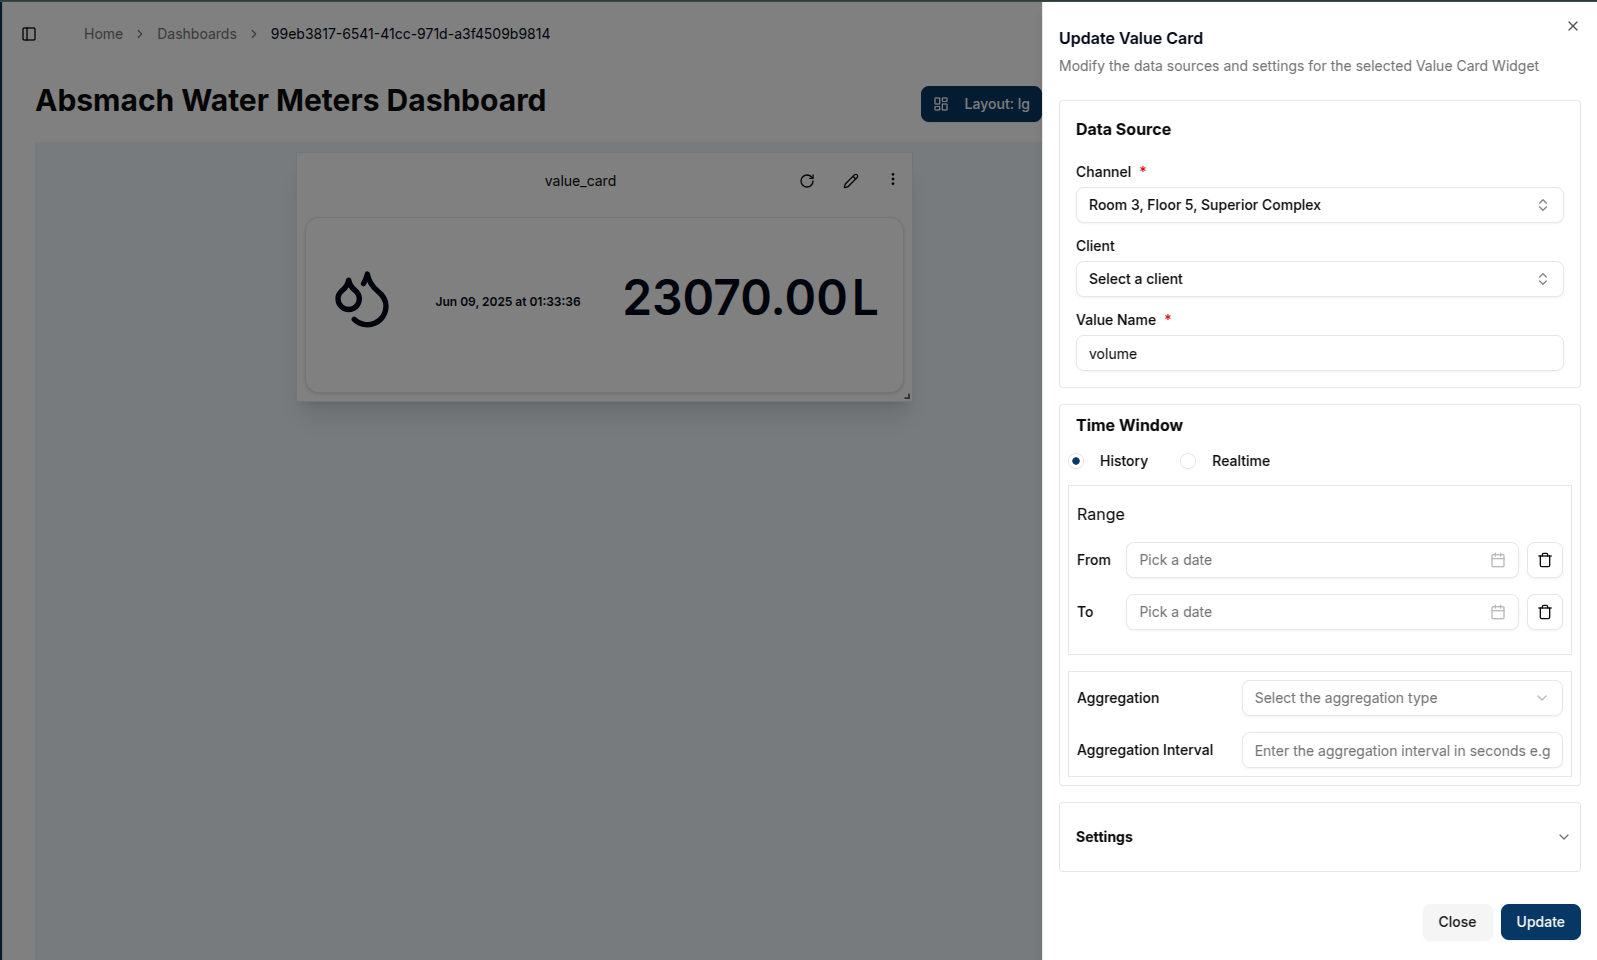
To edit a Value Card, click the Pencil in the top-right corner of the widget. This will open a settings sheet on the right, where the data source, title, icon, and other settings can be adjusted.
- Data Source: Modify the channel, client, or value name if needed.
- Title: Change the title of the value card to reflect the new information.
- Unit: Update the unit if the data type changes (e.g., from liters to cubic meter).s
- Icon: Select a new icon that matches the updated data context.
- Label: Update the label to one that matches the updated data context.
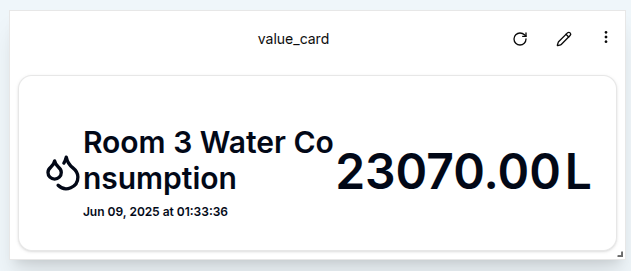
Once the desired updates are complete, click Update to save the changes. The card will refresh to show the updated data and icon.
Customizing Value Cards
- Icons: Selecting an appropriate icon is essential for visually representing the type of data displayed. For example, an "activity" icon might indicate voltage, while a "thermometer" icon could represent temperature.
- Display: Value Cards show the current value, associated unit, and last update time, making them ideal for quickly interpreting the latest state of connected devices or systems.
Conclusion
Value Cards are a practical tool for displaying real-time metrics from connected channels. By focusing on the most recent value, they provide a concise and immediate overview of key parameters. With customizable titles, icons, units, and refresh intervals, Value Cards offer a flexible solution for monitoring critical data at a glance.