Dashboard Guide
Create a New Dashboard
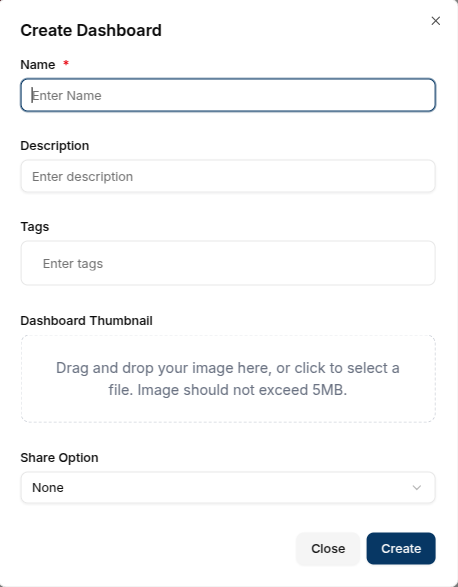
After logging into a Domain, navigate to Dashboards tab and click on the + Create button. A dialog box will prompt you to enter a dashboard name and optionally add a description, tags, a thumbnail, and a sharing option. Sharing options can be none, domain members, selected users or public.
To learn more about the available share options, see the Update Dashboard Share State section below.
View Dashboards
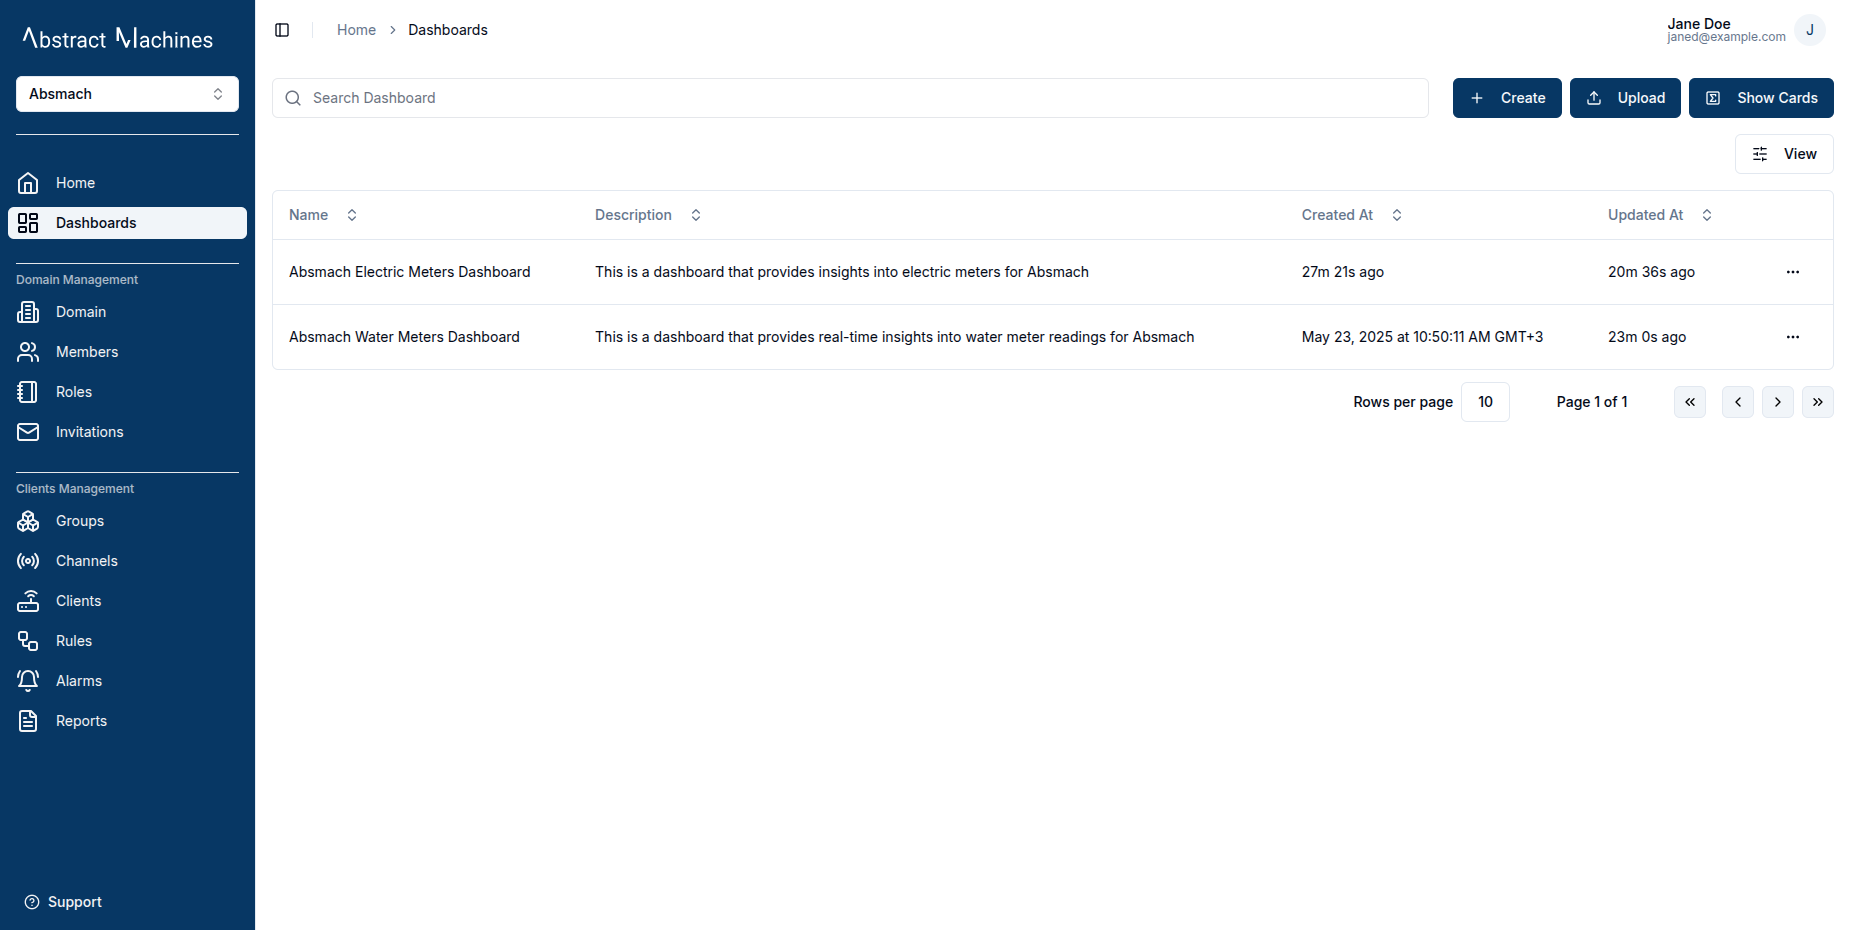
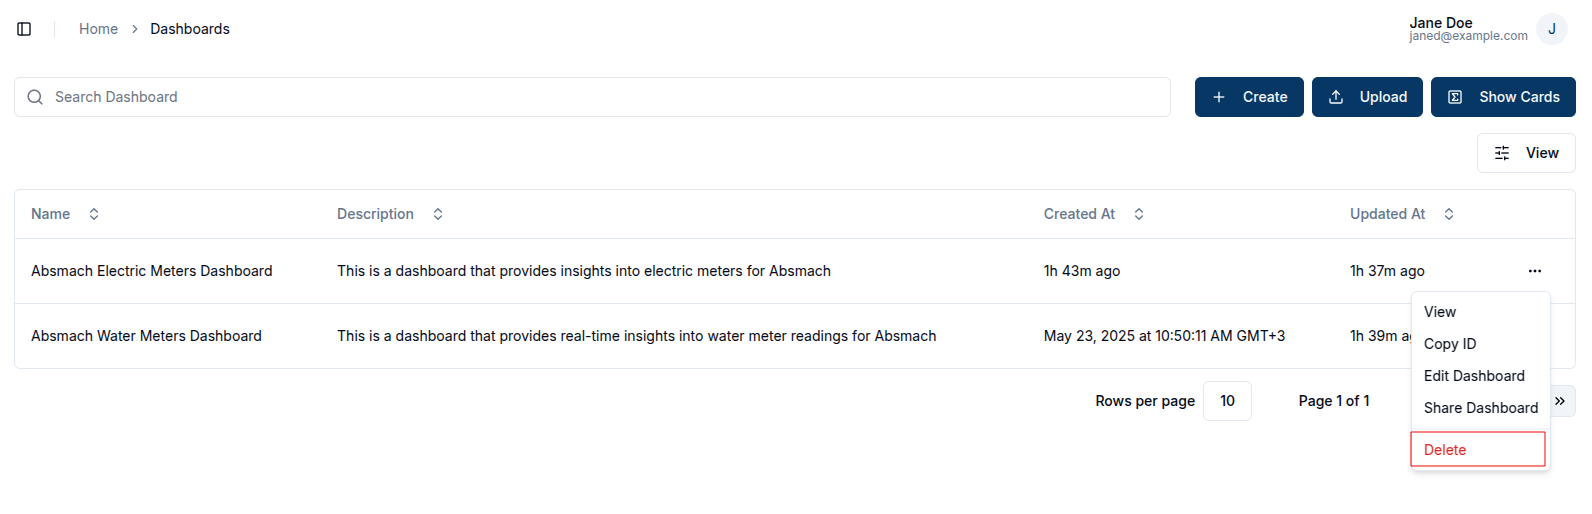
By default, dashboards are displayed as cards. To switch to table view, click the Show Table button at the top right. This displays the same dashboards in a table format.
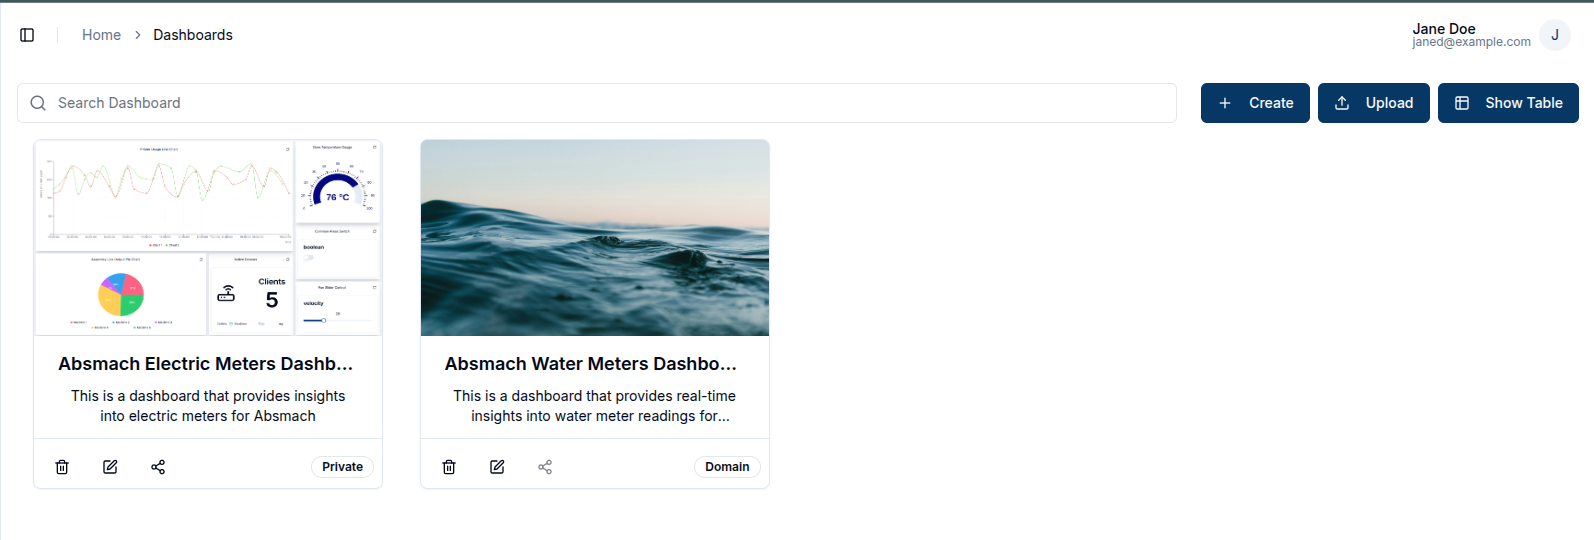
To switch back to card view, click the Show Cards button.
Edit Dashboard
To edit a dashboard, click the Edit icon on the dashboard card. This opens a side panel from the right.
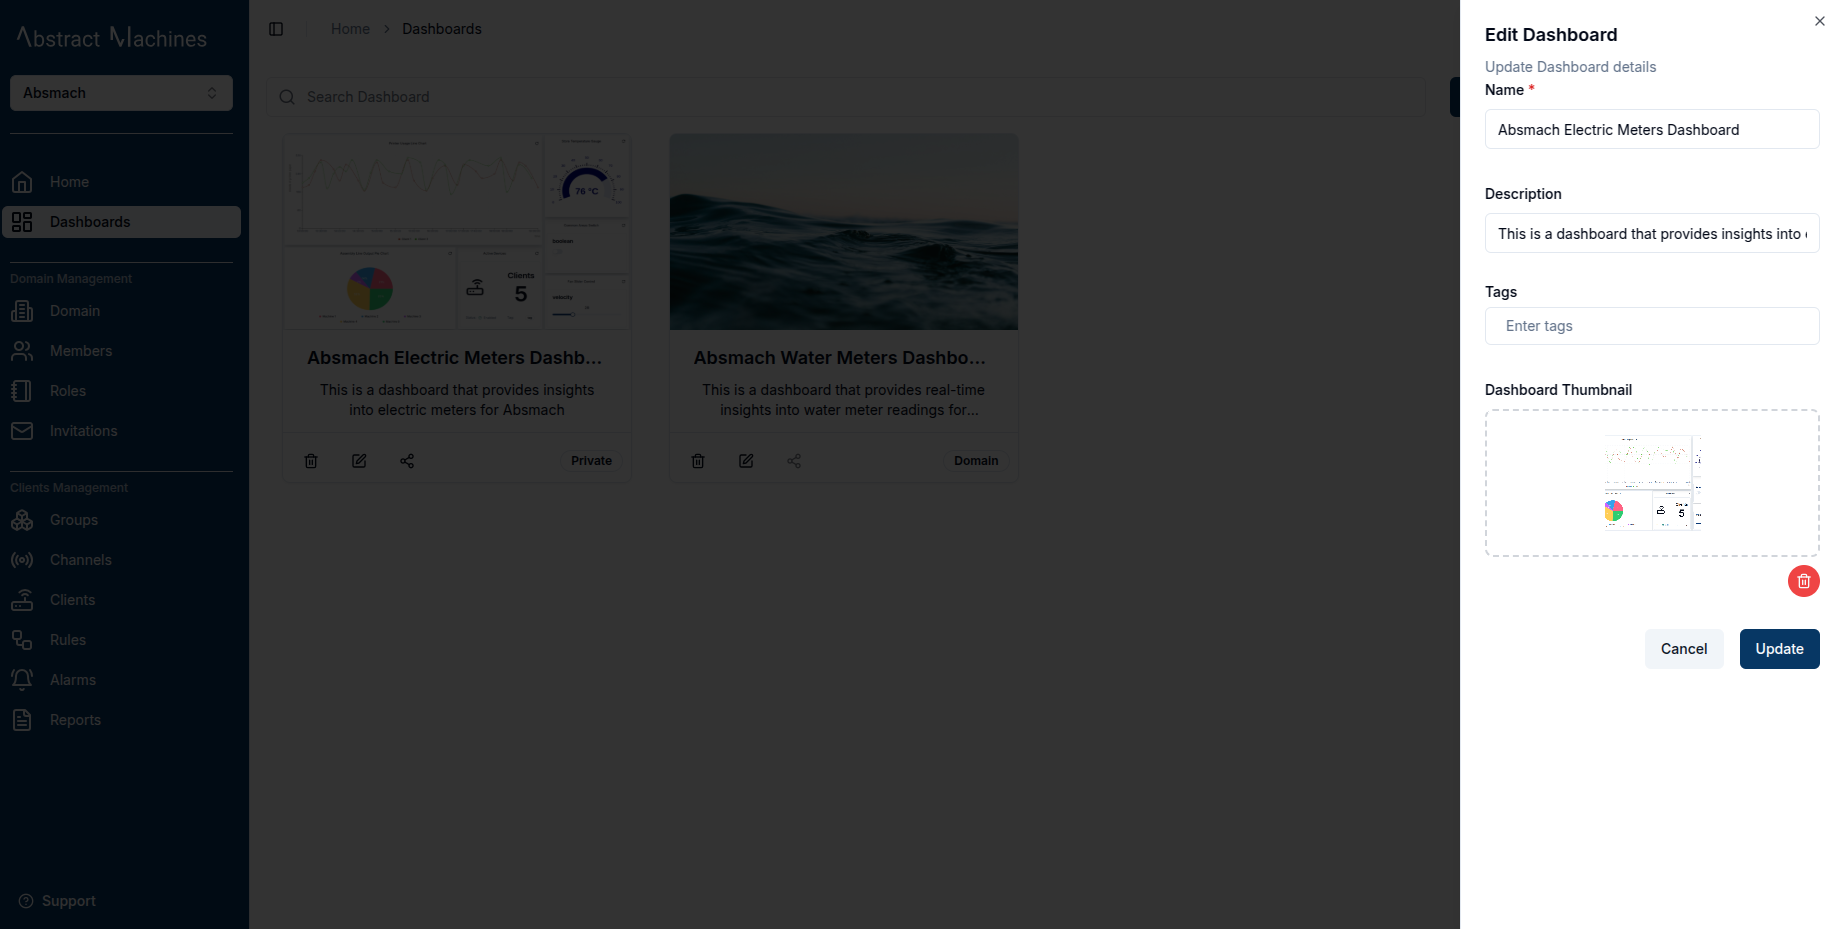
In the editing panel, a user can modify the dashboard's name, description, tags and dashboard thumbnail .
Update Dashboard Share State
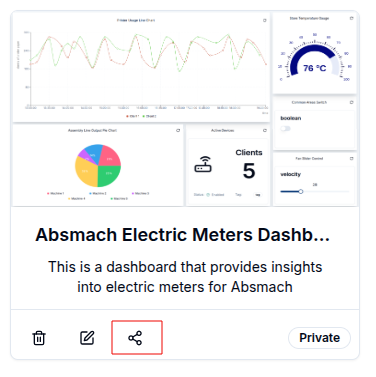
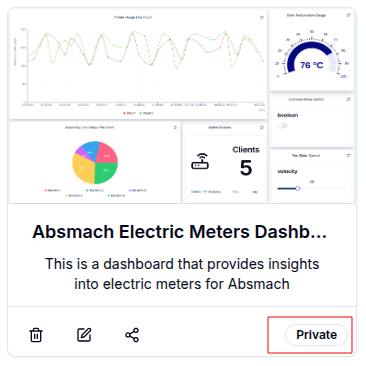
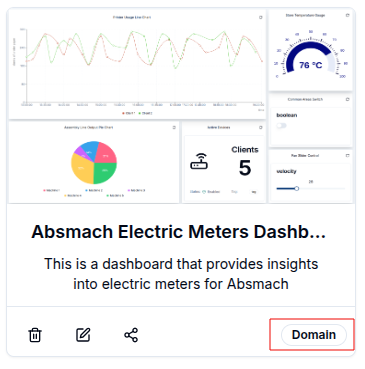
To change a dashboard’s share settings, click the Share button on the dashboard card:
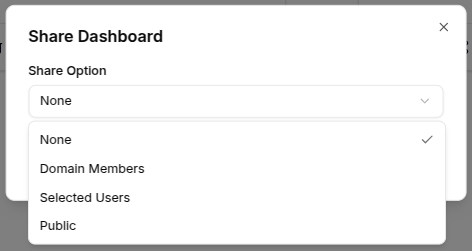
This opens a dialog with the available share options:
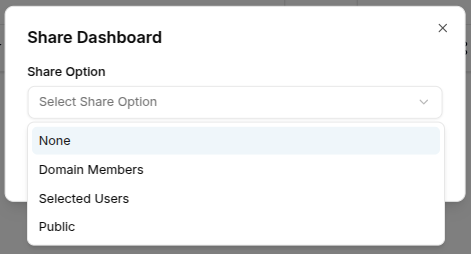
The available sharing options are:
- None - The dashboard is private and visible only to you
- Domain Members - The dashboard will be accessible to all domain members
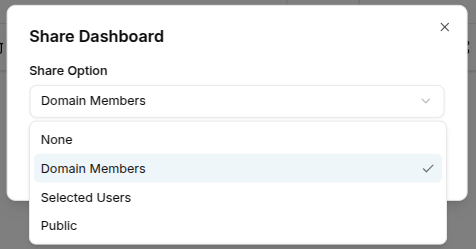
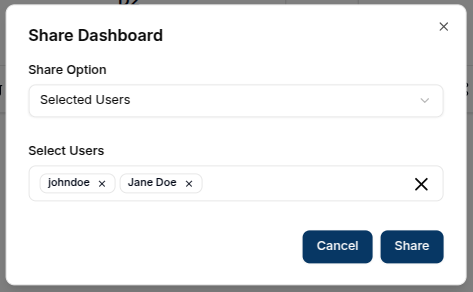
- Selected Users - Only specific domain members can access the dashboard

- Public - Anyone with the link can access the dashboard
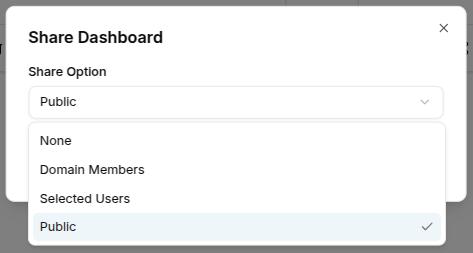
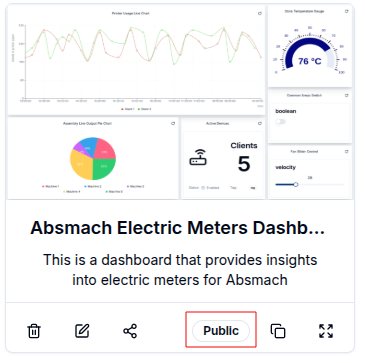
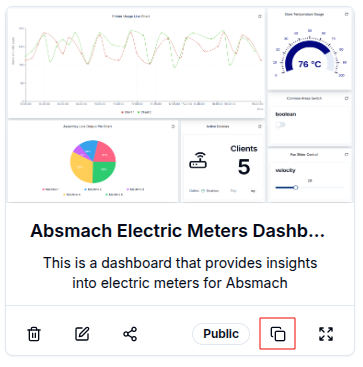
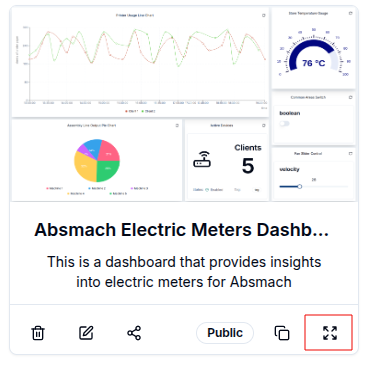
Public Dashboard Options:
On public dashboards:
- Click the
copybutton to copy the link and share it with others.
- Click the
fullscreenicon to view the dashboard in full screen.
Delete Dashboard
A user can delete a dashboard by clicking the Trash icon on the card or clicking Delete in the options on the dropdown menu in table view.
A confirmation prompt will appear to verify the action.
![]()
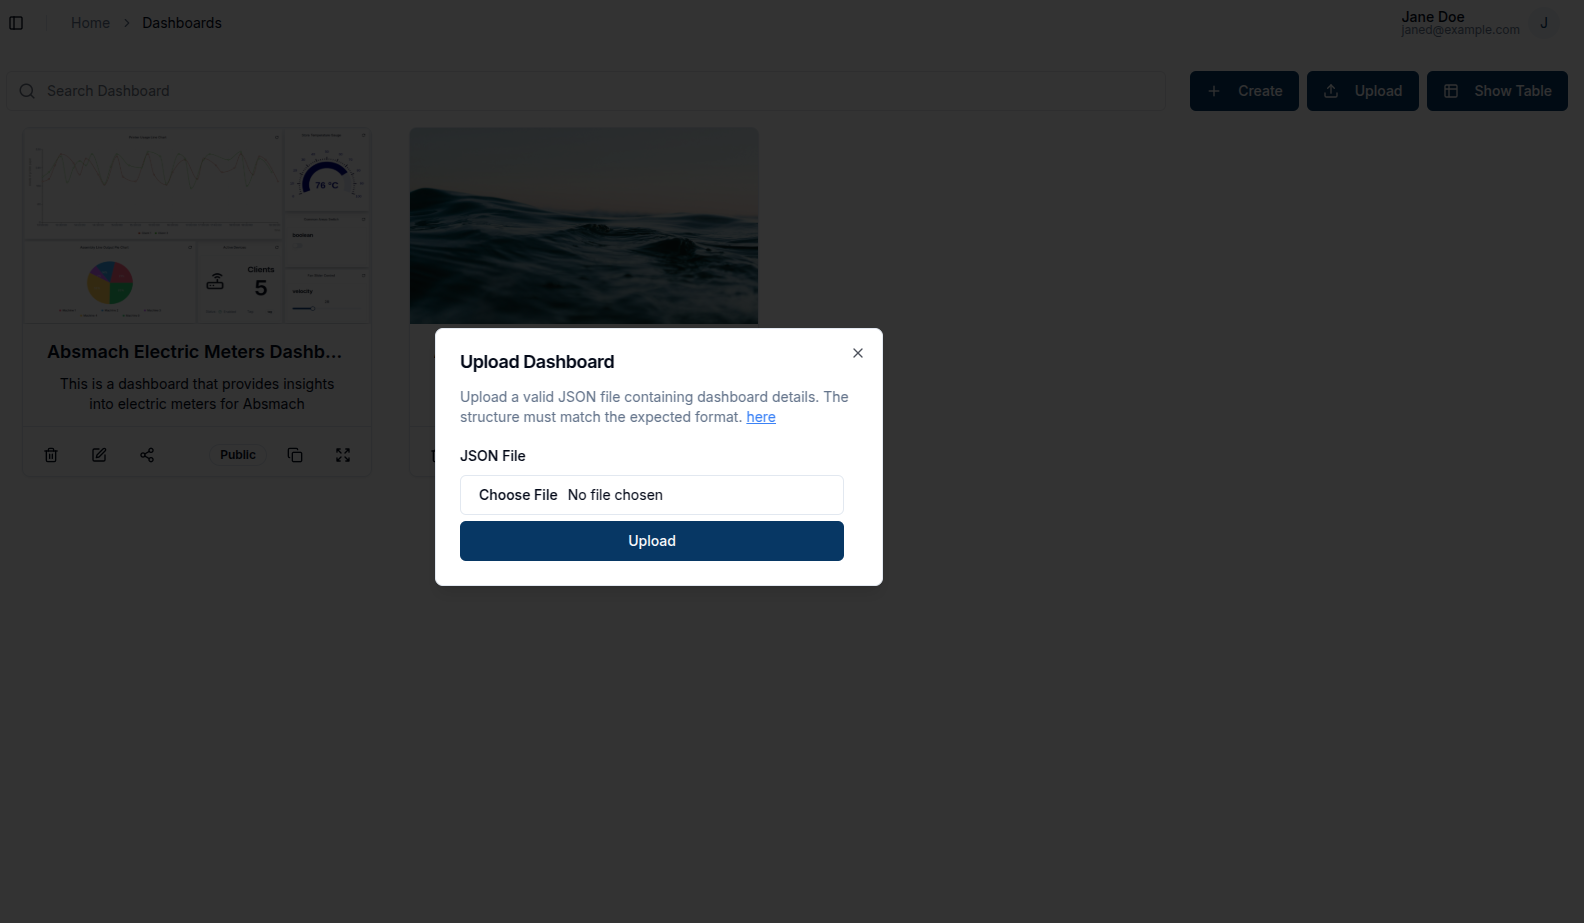
Upload Dashboard
Magistrala allows dashboards to be uploaded in .JSON format.
By clicking the Upload button at the top of the dashboard table, a dialog box will open, allowing users to select and upload a .JSON file containing the required fields for a complete dashboard.
Make sure your file includes the dashboard name, layout, and metadata.
The uploaded dashboard will then appear in the list with the uploaded data.
Sample templates to support real-life use cases can be found here.
Access a Dashboard
Dashboards can be accessed by clicking on the respective card or corresponding row in the table view.
Customize a Dashboard
Edit a Dashboard
Toggling Edit Mode enables dashboard editing features. In this mode, users can add, modify, or remove charts and widgets, as well as update the dashboard's name and description using the Edit Dashboard button.

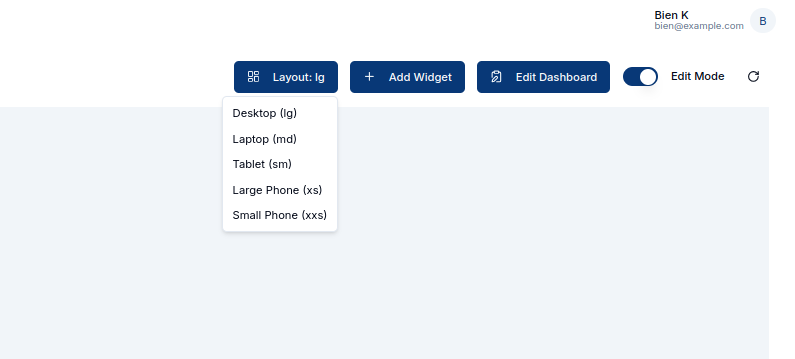
Choose a Layout
Layouts allow users to select a layout type that suits their needs, optimizing the dashboard for different screen sizes. Available options include layouts for desktop, laptop, tablet, phone or small phone — each adjusting the dashboard grid width for better responsiveness.
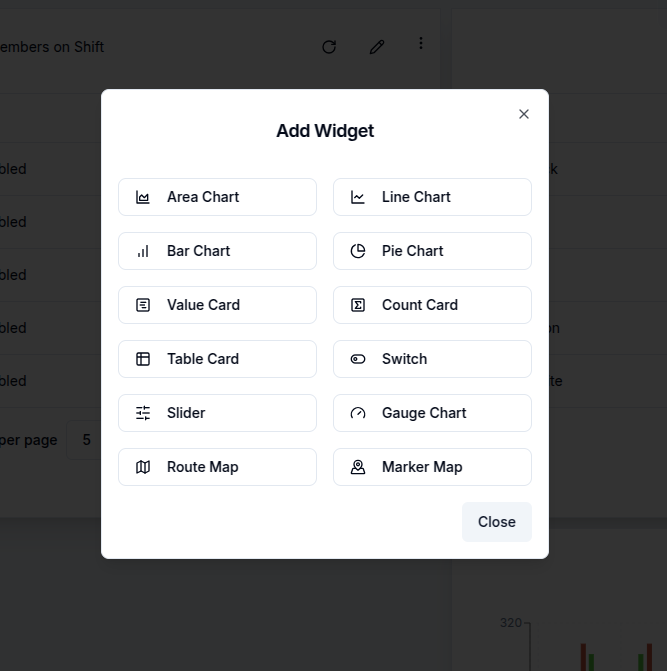
Add a Widget
To add widgets, users can click Add Widget at the top of the page, opening a dialog box with available charts and widgets for selection.
When edit mode switch is toggled off a user has access to:
Full-Screen Mode
For an expanded view, clicking the Full Screen button allows the dashboard and its charts to occupy the entire screen.

Download a Dashboard
Download a Dashboard as pdf
The PDF icon allows downloading the dashboard as a PDF file.

Download Dashboard as json
The Download icon enables downloading it as a JSON file.

Share Dashboard
Allows the user to update the share state for the dashboard.
